


Ok, my stats loving friends, here’s some quick data reflecting the single family homes sales in Andover, North Reading, and Reading in the First Quarter of 2016 vs First Quarter of 2017.
North Reading Q1 2016 vs Q1 2017
Number of Homes Sold
Q1 2016: 25
Q1 2017: 28
Average List Price:
Q1 2016: $503,731
Q1 2017: $540,575
Average Sale Price
Q1 2016: $497,108
Q1 2017: $530,882
Average Days Until Offer:
Q1 2016: 49
Q1 2017: 39
Andover Q1 2016 vs Q1 2017
Number of Homes Sold
Q1 2016: 58
Q1 2017: 61
Average List Price:
Q1 2016: $588,800
Q1 2017: $678,151
Average Sale Price
Q1 2016: $574,228
Q1 2017: $667,498
Average Days Until Offer:
Q1 2016: 60
Q1 2017: 57
Reading Q1 2016 vs Q1 2017
Number of Homes Sold
Q1 2016: 37
Q1 2017: 29
Average List Price:
Q1 2016: $491,090
Q1 2017: $562,500
Average Sale Price
Q1 2016: $487,124
Q1 2017: $563,491
Average Days Until Offer:
Q1 2016: 53
Q1 2017: 32
Some of the more interesting numbers:
- The average sale of a single family jumped $34,000 in North Reading, $93,000 in Andover, and $76,000 in Reading
- Reading had a significant drop in Days Until Offer – 53 to 32
- Reading had an average sale OVER the listed price
For more information on home sales North of Boston, contact President of Residential Sales, Paul Santucci 617.694.0004
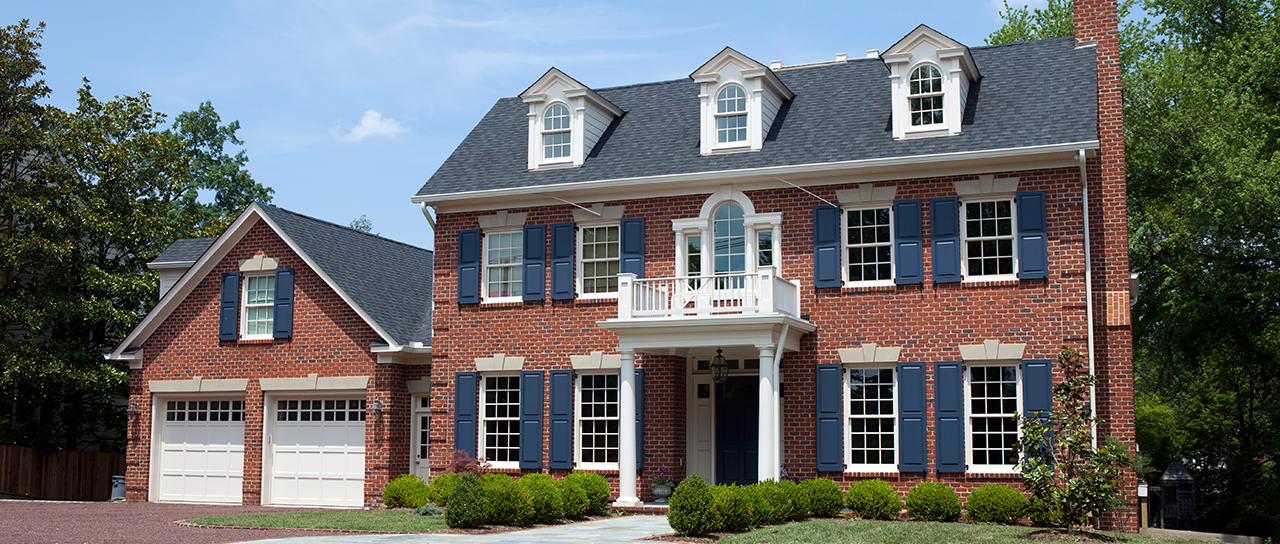
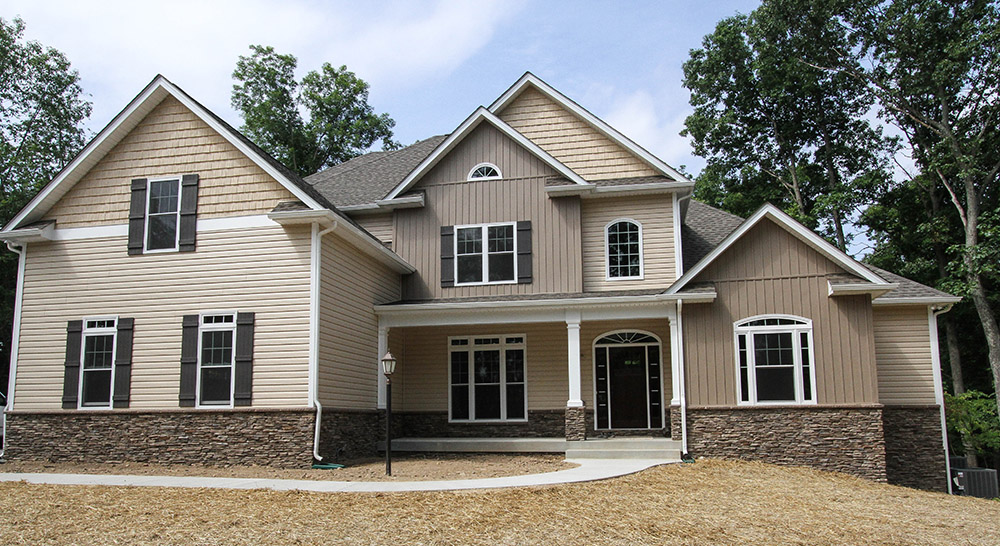
4 JACOB RAYNOR LANE, North Reading's most expensive sale in Q1 2017


Follow us: